Question
How to analyse my MNase-seq data ?
How to upload my MNase-seq data into the VRE ?
How to launch Nucleosome dynamics once in the VRE ?
How to visualize my results ?
Keywords
MNase-seq data, BAM files, Nucleosome positioning, Promoter classification, Nucleosome stiffness, Nucleosome periodicity, Nucleosome free regions, Nucleosome changes, TSS
Outcomes
This tutorial will guide you through the different steps from uploading your files to visualising the results of the analysis.
Files Required
- BAM files *
* BAM files are obtained by aligning the FASTQ files with the genome of reference. Two common aligners, BWA and Bowtie, have been implemented in the VRE and can be used to generate the BAM files.
Available Tools
Several tools have been implemented to analyze MNase-Seq data.
- NucleR
- Nucleosome Dynamics
- Nucleosome Free Regions
- Nucleosome Periodicity
- TSS classification
- Stiffness
Procedure
Upload and validate your files
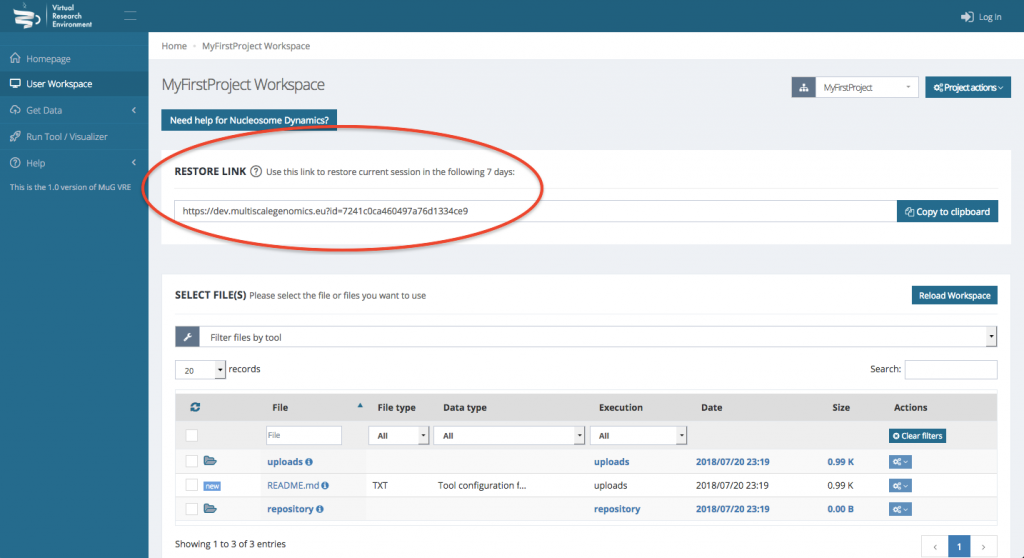
IMPORTANT : Note that your workspace is not persistent. If you want to be able to access your workspace again, you either need an account or you need to save the URL shown in the Restore Link box.
Steps
- If you have an account, Log in to the VRE. Otherwise, note the URL that appears on the User Workspace.
- (Optional) If you want to analyse data from different projects, you can create different projects where your data and results will be stored. To do so, click on “project actions” in the top right corner of your workspace and select “Create new project”.
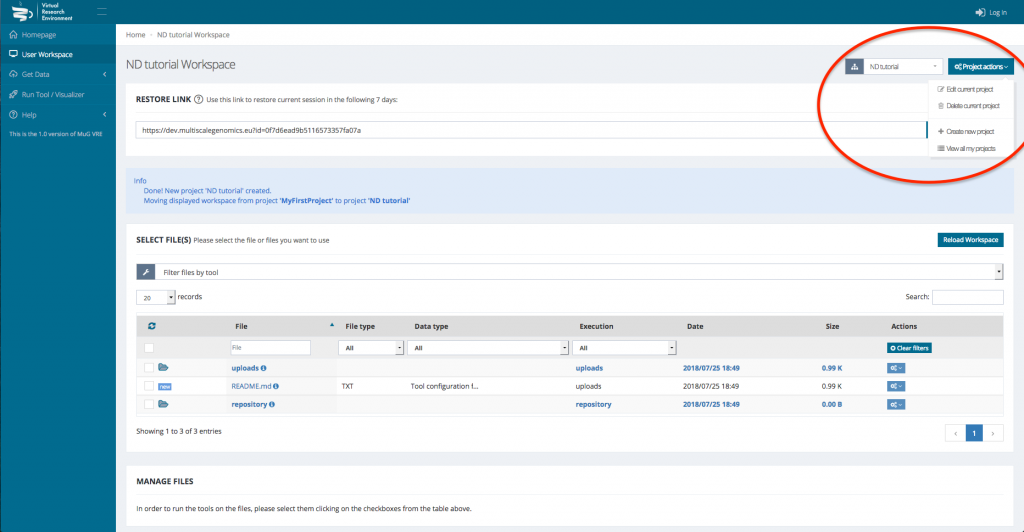
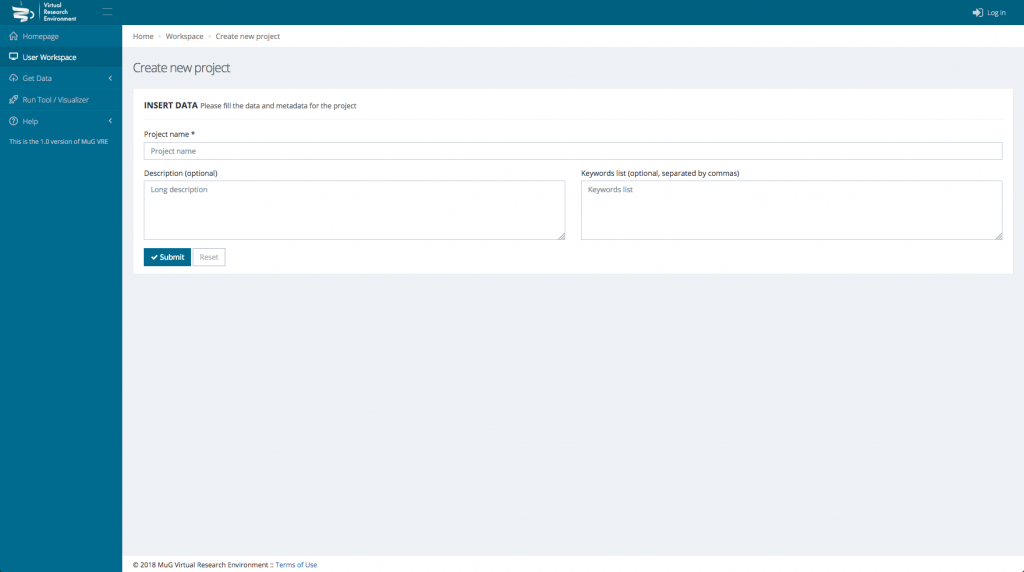
This will open a new window where you need to enter the Project name and eventually a description and some keywords.
- Navigate to the “Get Data” via the left hand menu then click on “Upload Files”. Optionally, to explore Nucleosome Dynamics tool using the example BAM files we provide, click on “Import example dataset” from the “Get data” menu. Select the option “Nucleosome Dynamics analysis” for a small example of one S. cerevisiae chromosome, or one of the “Nucleosome Dynamics example” datasets for a whole genome analysis. Click on “Import” button and jump to the next section in this tutorial (Launch Nucleosome Dynamics).
- Upload your BAM files (or your FASTQ file(s)) either from your computer or from an external URL
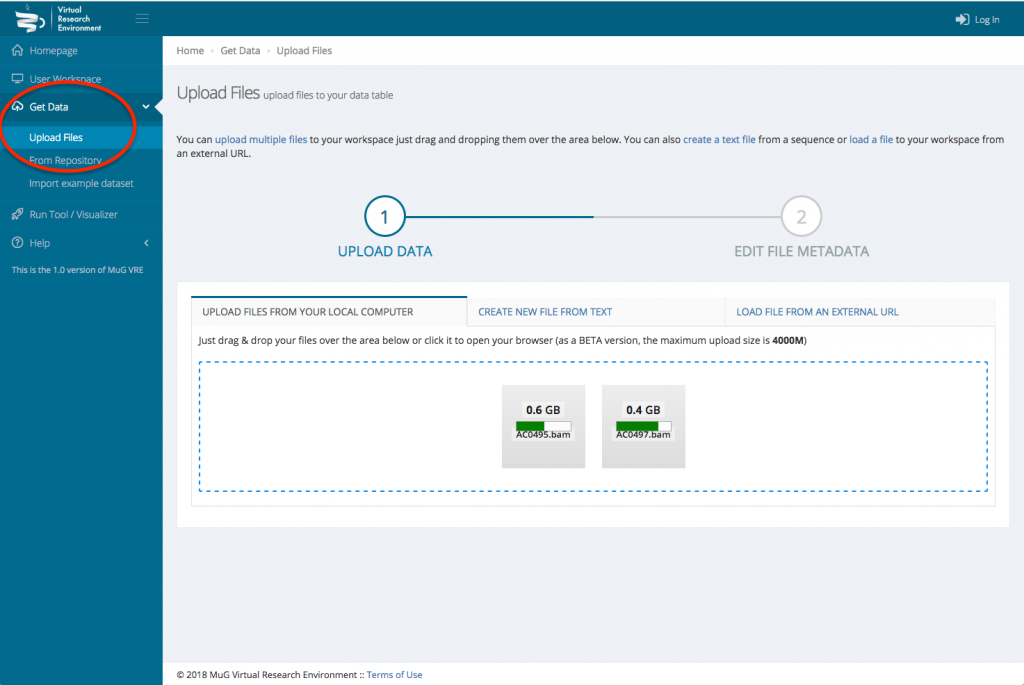
- Once the upload is complete, edit the file metadata : Indicate the data type, the Taxon Name or Taxon ID, the genome of assembly if relevant, the BAM type (Paired-End or Single-End) and whether the coordinates are sorted or unsorted. You can only edit the metadata for one file at a time.
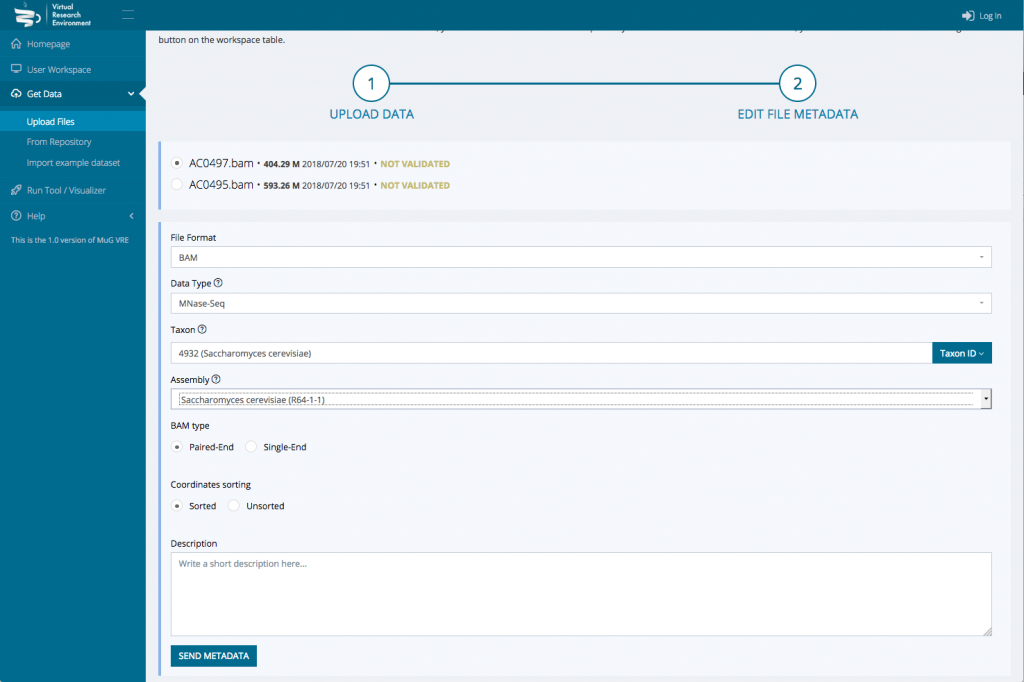
- Then press Send Metadata and Accept changes. At this point, you will be redirected to your user workspace where your files appear in the uploads.
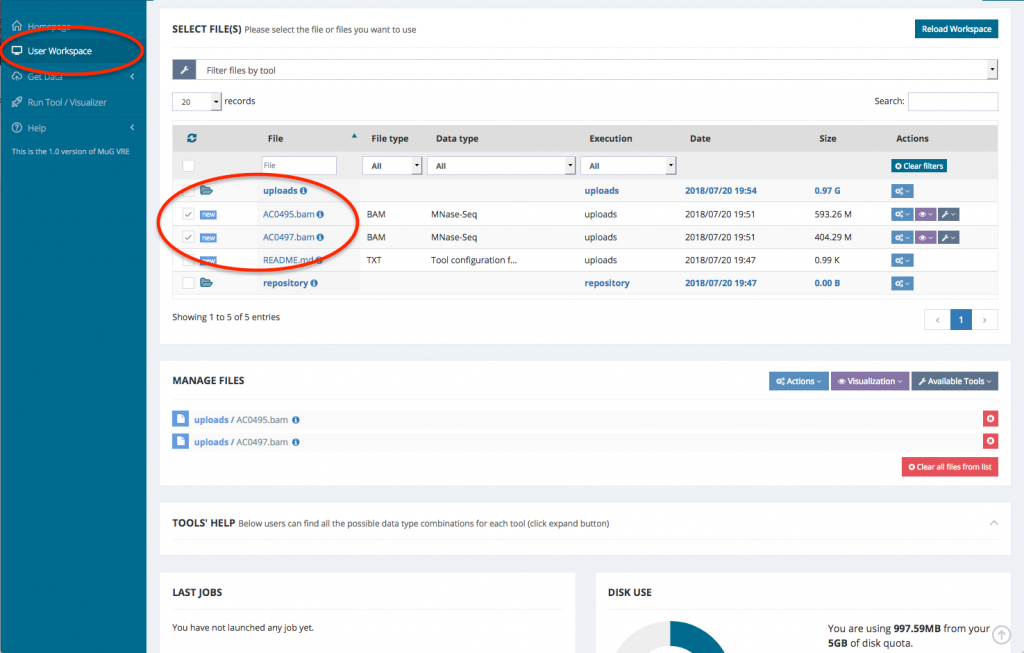
- Once the validation is complete, your files are ready for analysis
Launch Nucleosome Dynamics
Nucleosome Dynamics proposes a subset of tools (NucleR, Nucleosome Dynamics, Nucleosome Free Regions, Nucleosome Periodicity, TSS classification and Stiftness) that can be launched independently. You can launch those tools either from the workspace or from the “run tool/visualizer” menu.
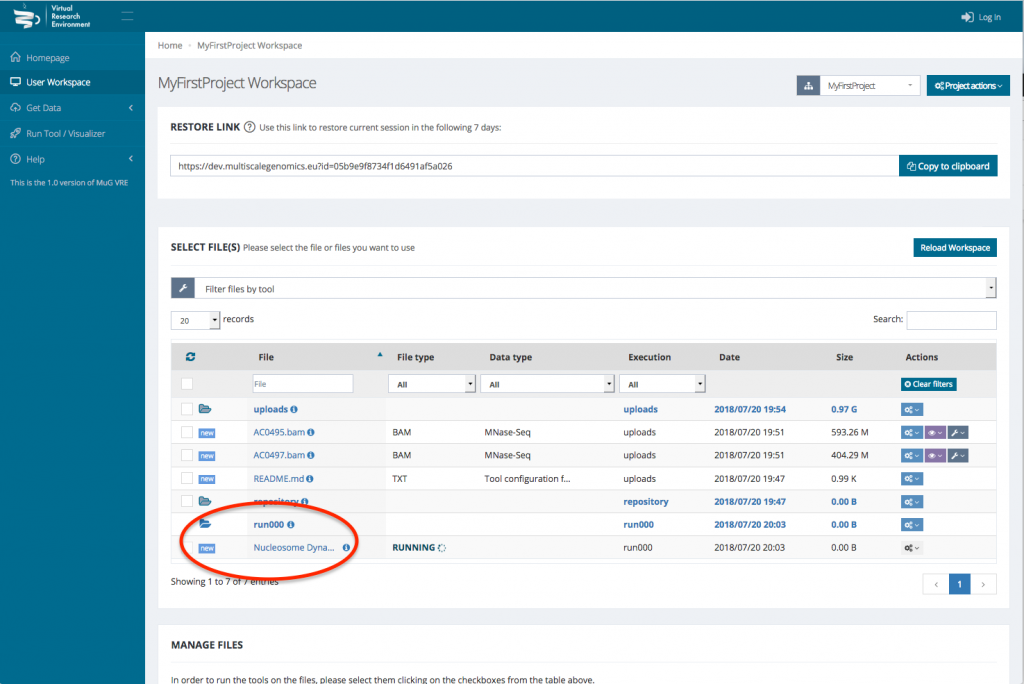
Steps launching ND from your workspace
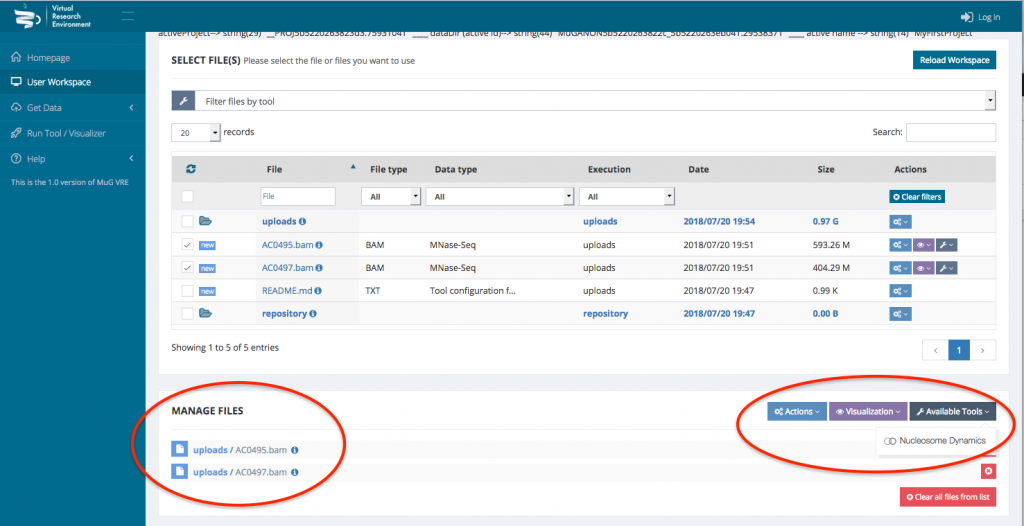
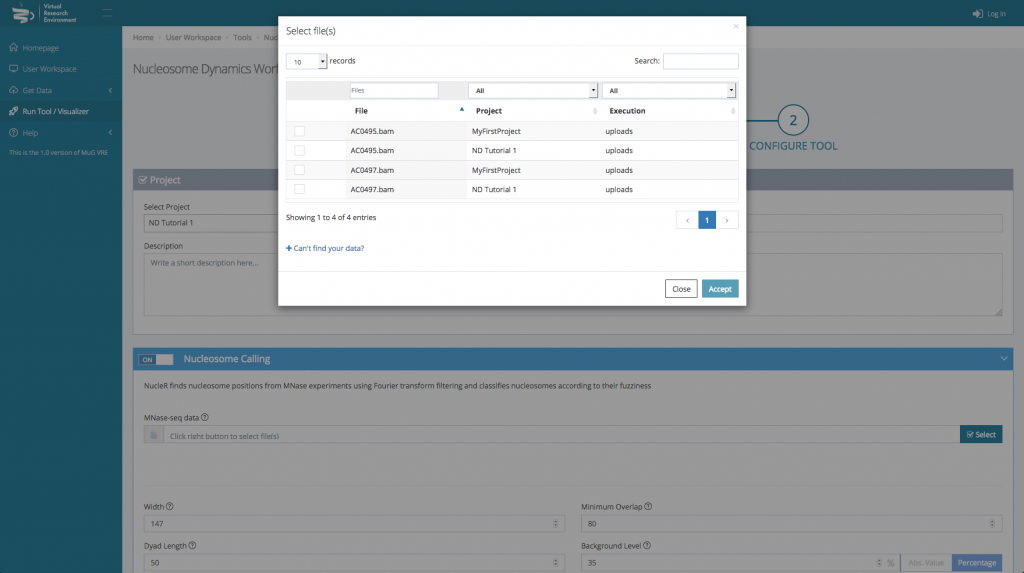
- Select the BAM files that you want to analyse. To run a comparison using Nucleosome Dynamics, you need to select the two BAM files that correspond to the conditions you want to compare.
- Once your BAM files are selected, you can decide how to manage the files (Actions, Visualisation, or Available Tools). To launch Nucleosome Dynamics, you must select Available tools and click on “Nucleosome Dynamics”
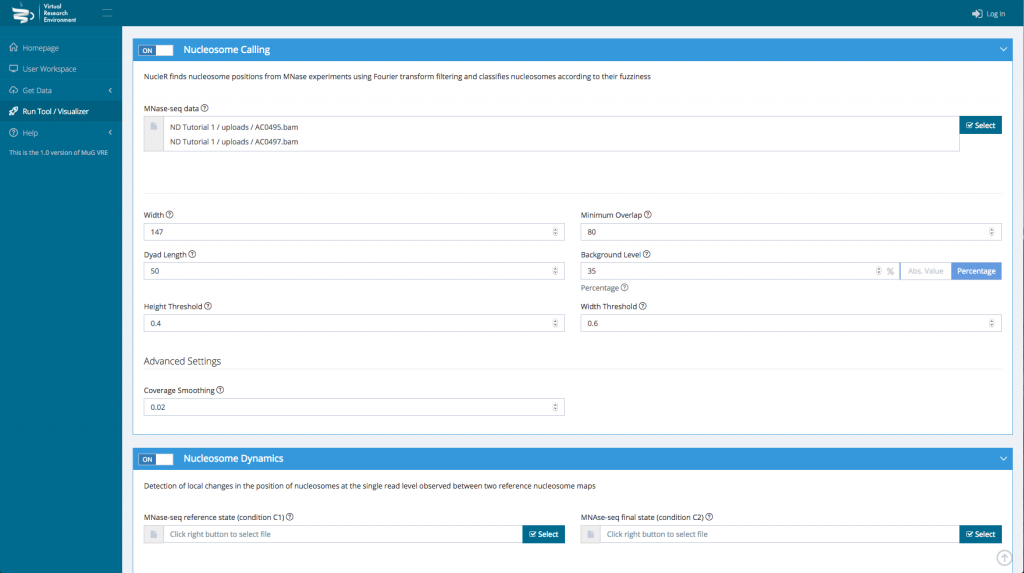
- This sends you to the Nucleosome Dynamics Workflow where you can select the analysis you want to perform (NucleR, Nucleosome Dynamics, Nucleosome Free Regions, Nucleosome Periodicity, TSS classification and Stiftness). For each tool you select, you can keep the default parameters, or enter new ones.

- Once you have selected the different analysis you want to perform, click on compute.
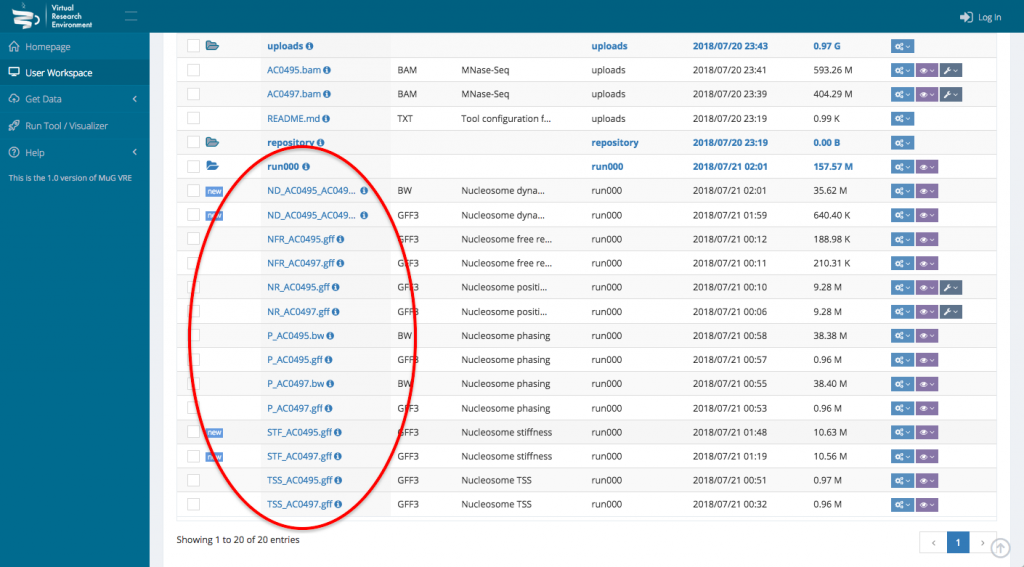
- This sends you back to your User workspace where a new folder is created in which all the results of the analysis will be stored. (for a description of each output files, see at the end of the tutorial or go to :
http://vre.multiscalegenomics.eu/tools/nucldynwf_pmes/help/outputs.php

Steps launching ND from the “Run Tool/Visualiser” menu
- Click on “Run Tool/Visualizer” in the left hand menu to open the Tool menu.
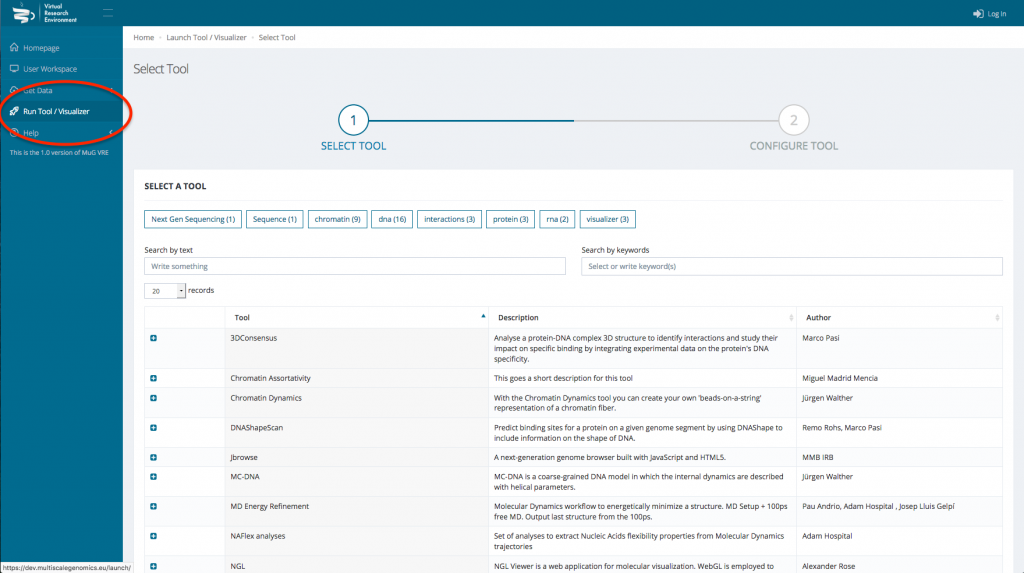
- Select Nucleosome Dynamics and click on “ANALYSE MNASE-SEQ DATA”
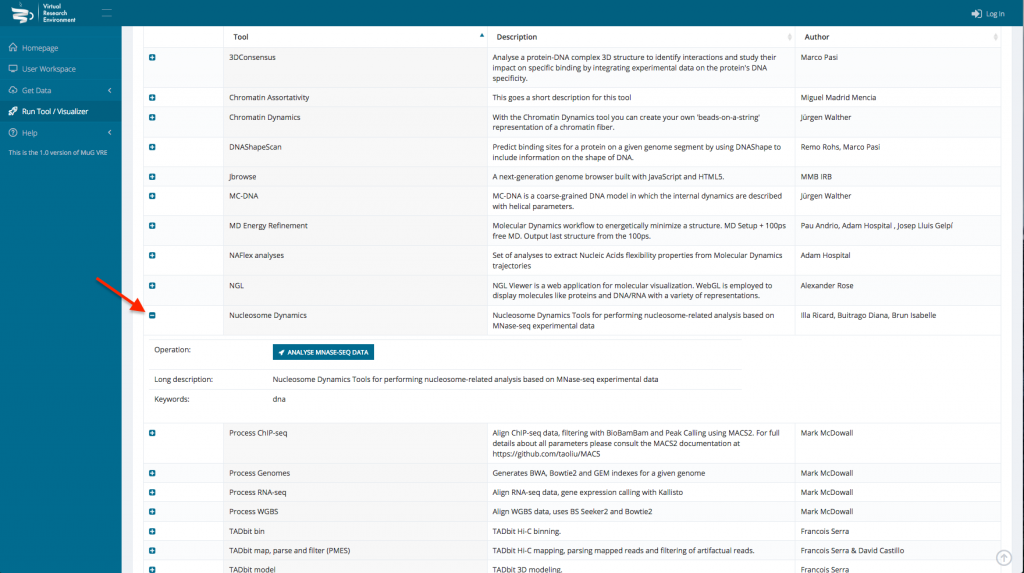
- This sends you to the Nucleosome Dynamics Workflow where you can select the project and the analysis you want to perform (NucleR, Nucleosome Dynamics, Nucleosome Free Regions, Nucleosome Periodicity, TSS classification and Stiffness).
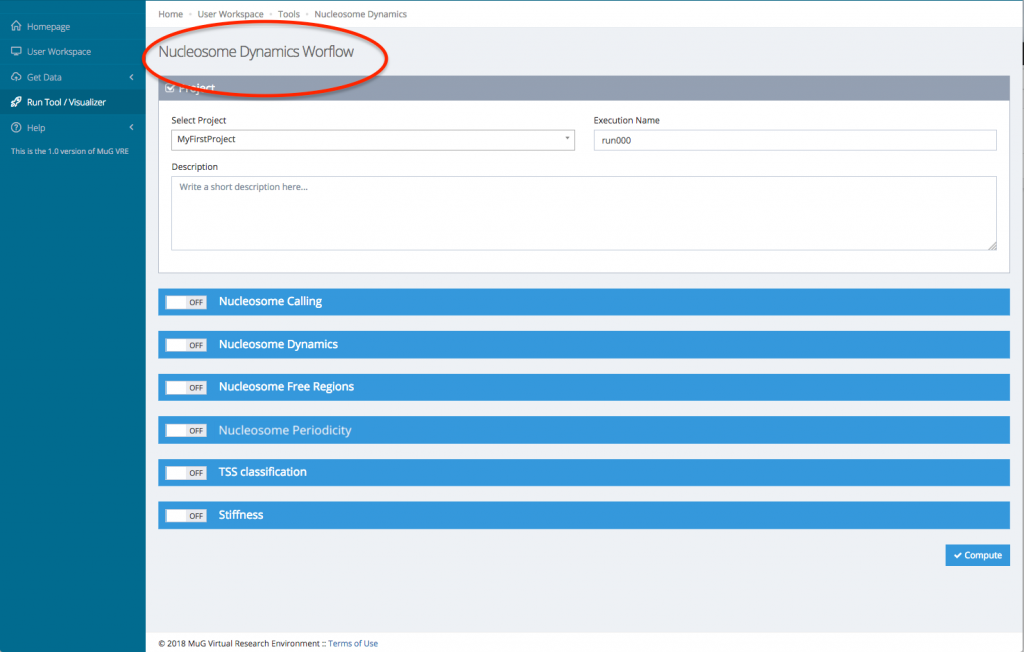
- Then, for each tool you select, you will need to indicate the files you want to analyse.
- Finally, you can select the parameters you want to apply. You can either keep the default parameters, or enter new ones.
- Once you have selected the different analysis you want to perform, click on compute.
- This sends you back to your User Workspace where a new folder is created in which all the results of the analysis will be stored. (For a description of each output files, see at the end of the tutorial or go to :
http://vre.multiscalegenomics.eu/tools/nucldynwf_pmes/help/outputs.php

Visualize your results
Once the analysis is complete, you can choose to download the Output files or to visualize them in JBrowse, the genome Browser integrated in the VRE. Nucleosome Dynamics also runs a whole genome analysis and provides some statistics displayed as tables and graphs that can be downloaded or visualised in the VRE.
Steps
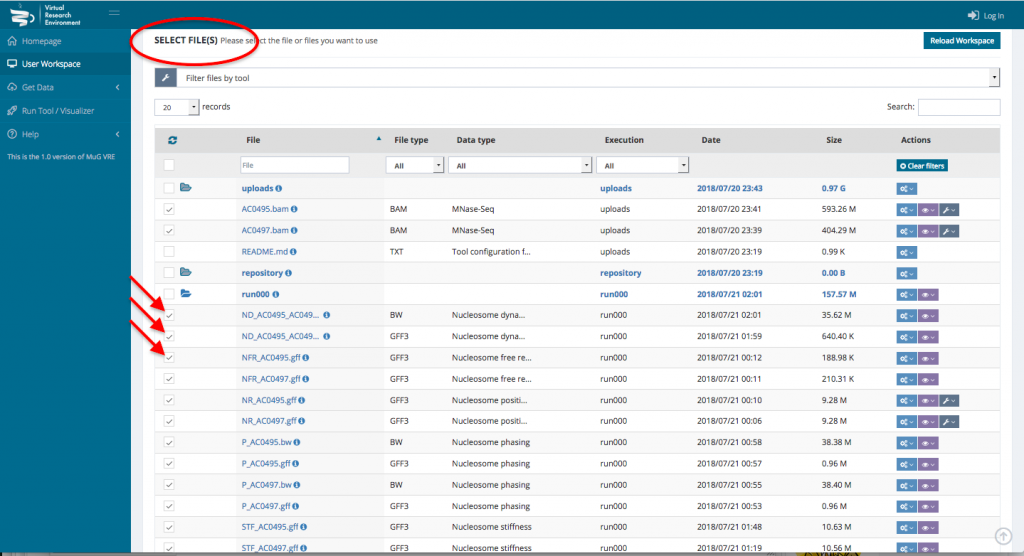
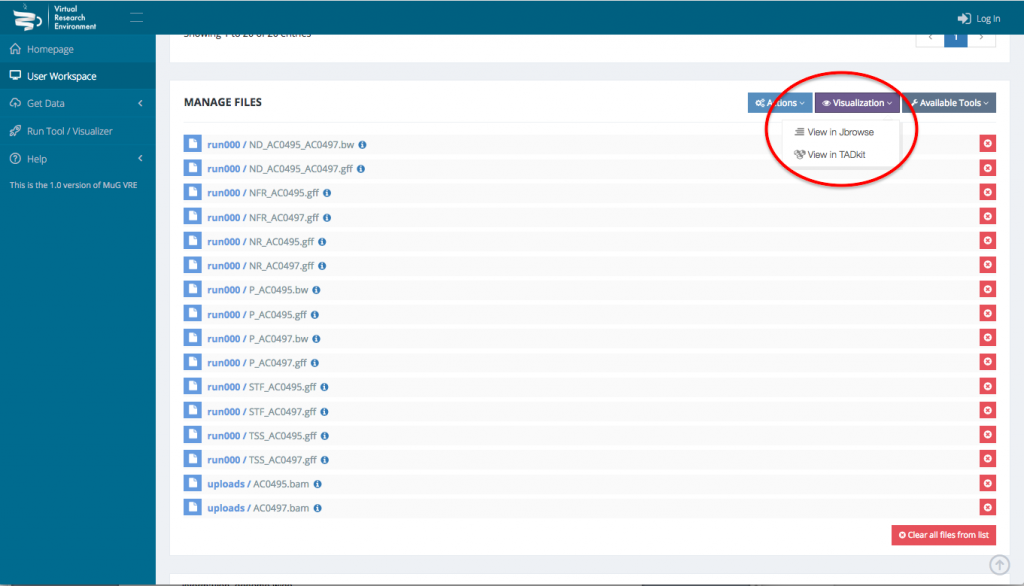
- To visualize the results in JBrowse, first select the output files that you want to visualize. Then, scroll down to the section “Manage your files”, select visualization and click on “view in JBrowse”.
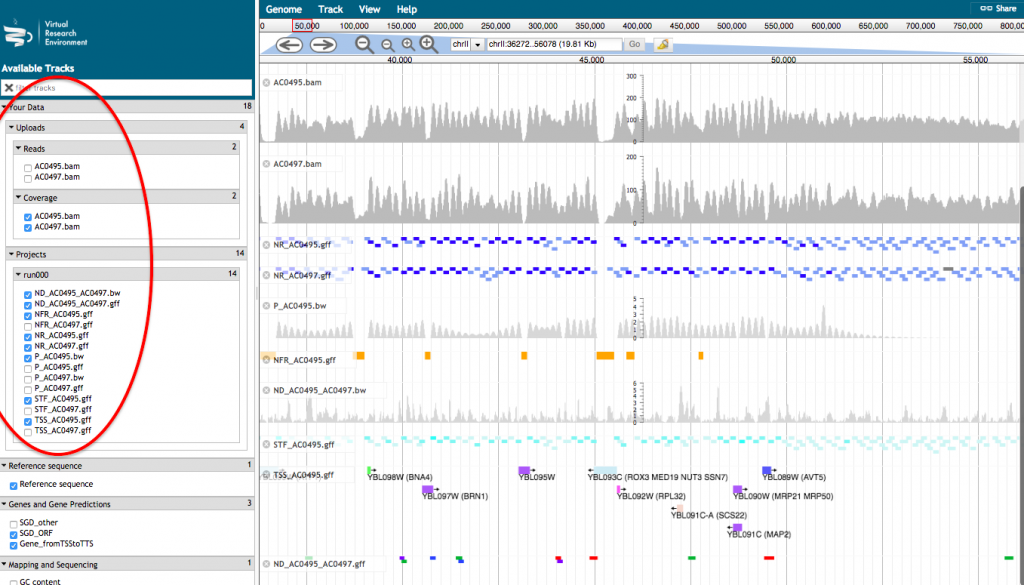
- A new tab will open with JBrowse where your files appear in the left hand menu in the section “Your data”. Each of those files will be represented as a track in the browser. Tick the box corresponding to the track(s) that you want to visualize in the browser.
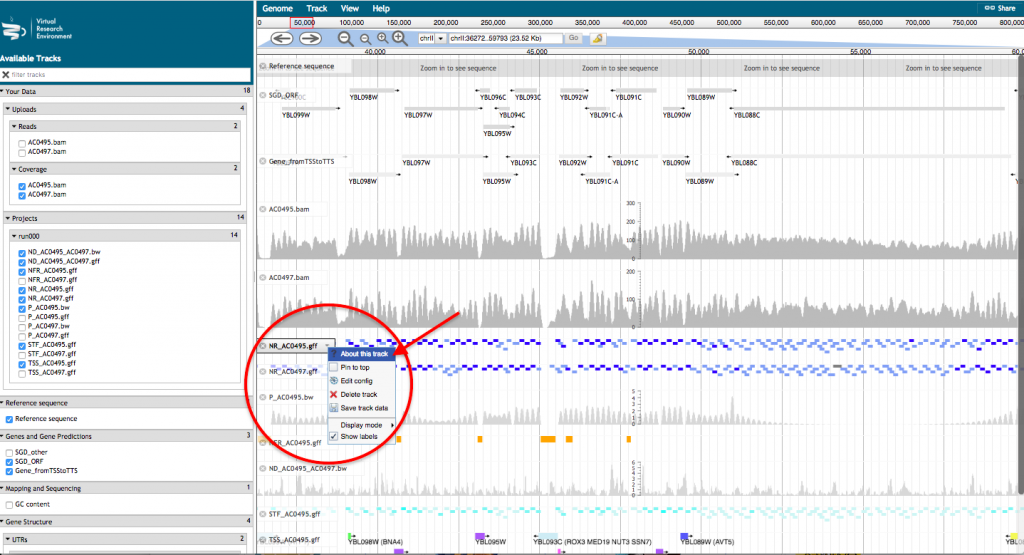
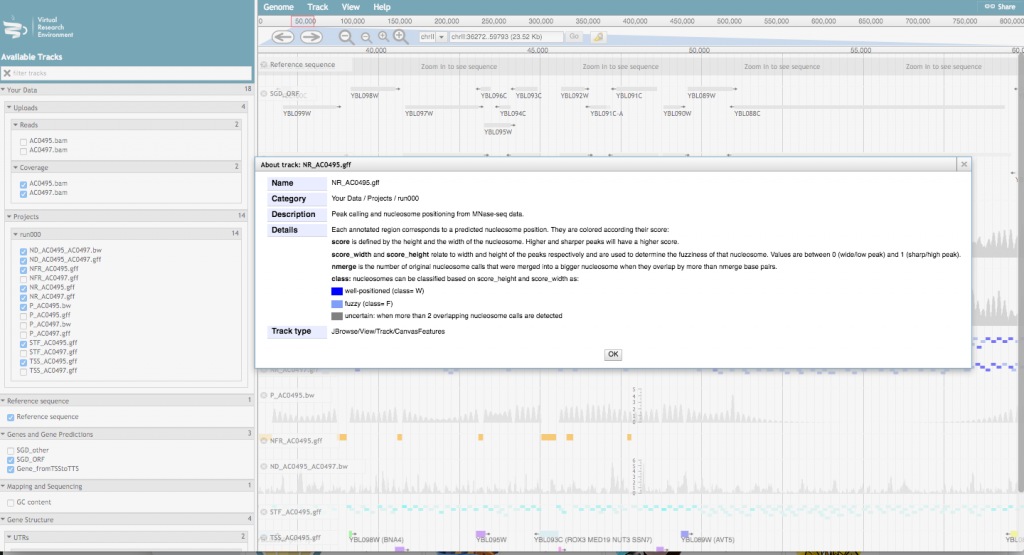
For a more detailed description of the track, click on the track name and select “About this track”
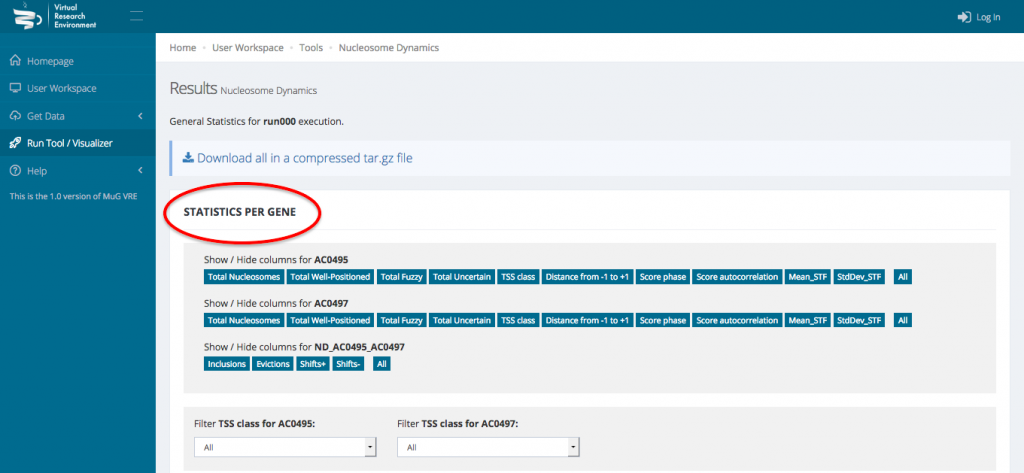
- To access the genome wide statistical analysis, go back to your Workspace and click on the “view icon” of the folder containing all the output files. Click on View Results.

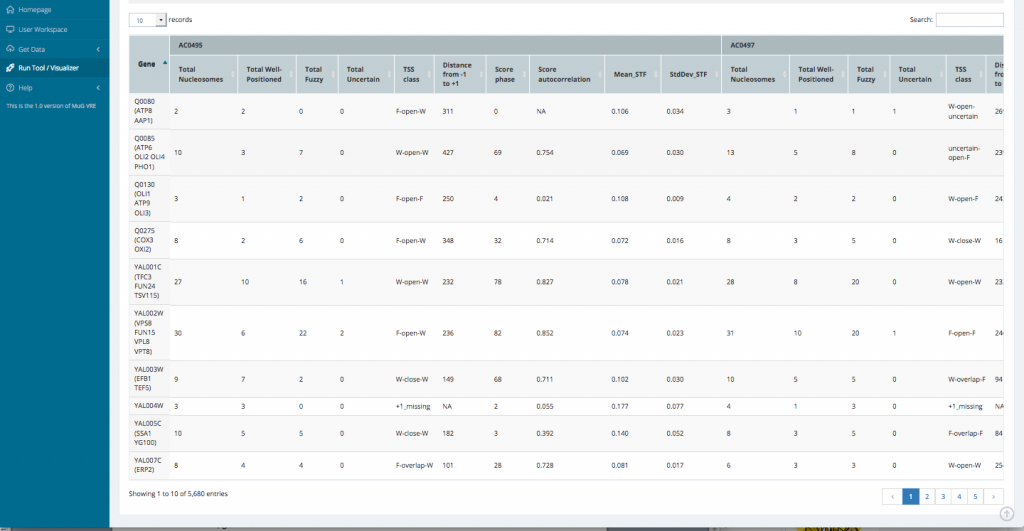
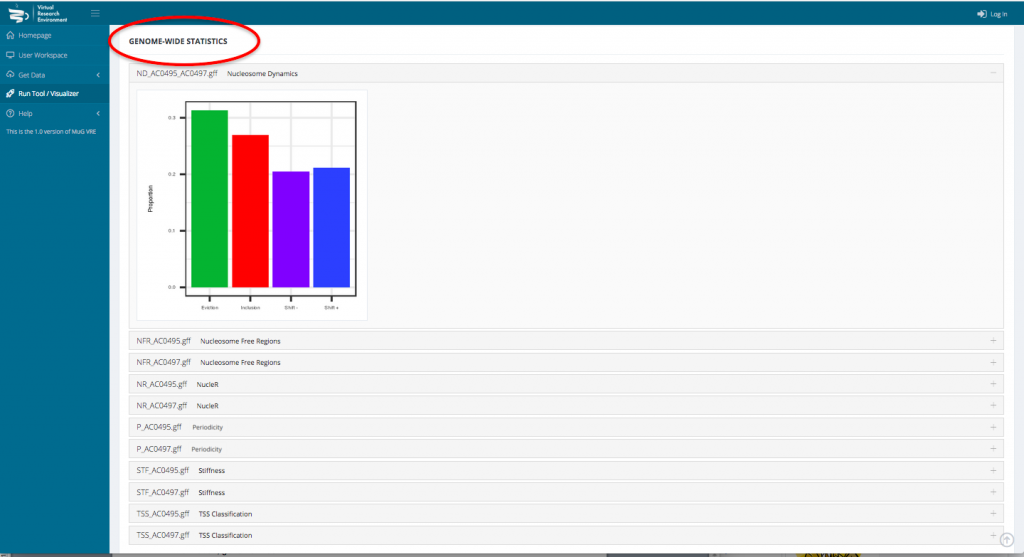
- This opens a new page displaying a table with the statistics per gene as well as a series of tables and graphs from the Genome wide statistics analysis. All these results can also be downloaded as a compressed archive.
Outputs
NucleR‘s output is a GFF3 file containing all the nucleosome calls.
Nucleosome Dynamics creates a bigWig file containing the -log10 of the p-value of how significant is the difference between both experiments and a GFF3 file containing the movement hotspots represented as color coded boxes
Nucleosome Free Region generates a GFF3 file containing the NFR regions coordinates. NFR are displayed as yellow boxes..
TSS classification output is a GFF3 file that contains all the transcription start sites information, genome wide.
Nucleosome Periodicity analysis returns 2 tracks for each experiment : a bigWig and a GFF3.
The bigwig file is a prediction of the nucleosome coverage along each gene, based on the first and last nucleosome. The GFF3 file displays each gene as a color box according to the “phasing” between the first and last nucleosome.
Stiffness creates a GFF3 output file representing every nucleosome as a box colored depending on its stiffness value approximated from the MNase-seq experiment.